


Prepared Exclusively for the Robin Salame Family Trust
Robin Salame Family Trust · Studio City · June 2026

The LAAA Team is a ten-person multifamily investment-sales group led by co-founders Glen Scher and Filip Niculete, working the San Fernando Valley and the Westside every day. We sell buildings exactly like 4254 Laurel Canyon: small, rent-stabilized, long-held family assets where the value is in the per-unit basis and the turnover upside.
That focus matters on a rent-controlled five-plex. The buyer pool, the financing, and the pricing all turn on how credibly the upside is underwritten, and on a team that can run a disciplined, confidential process to the right private capital. For 4254 Laurel Canyon, that means an evidence-based opinion of value anchored in recent, re-underwritten Studio City sales.
Closings the LAAA Team has completed, matched to 4254 Laurel Canyon on size, rent control, and ownership profile. These are our own sales, distinct from the market comps used to price the building.


• 35.5 median days on market — faster than the submarket
• 37% sold under 30 days, 64% under 60 days
• 59% closed within 3% of asking
• 145 closings with zero price reduction, 85 consecutive months with a closing
• Studio City: 8 sales / $54.3M • San Fernando Valley: 216 sales / $828M • 5–10 unit sweet spot: 169 sales / $388M
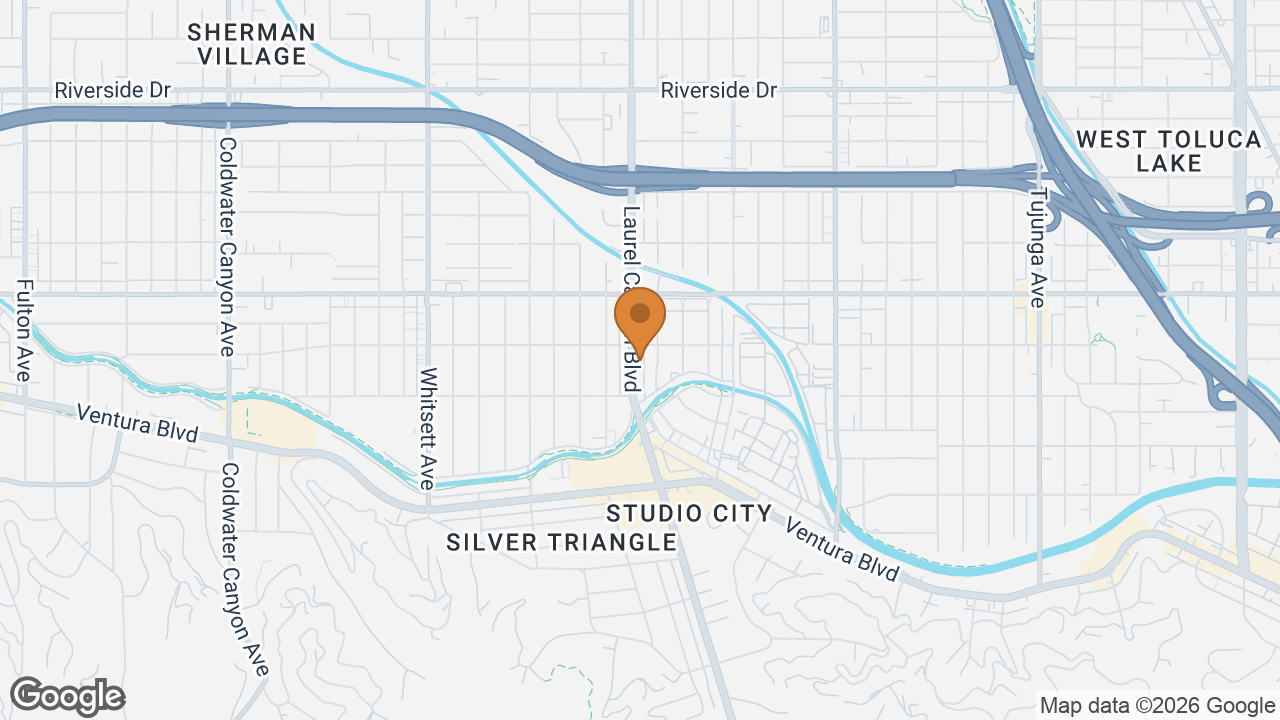
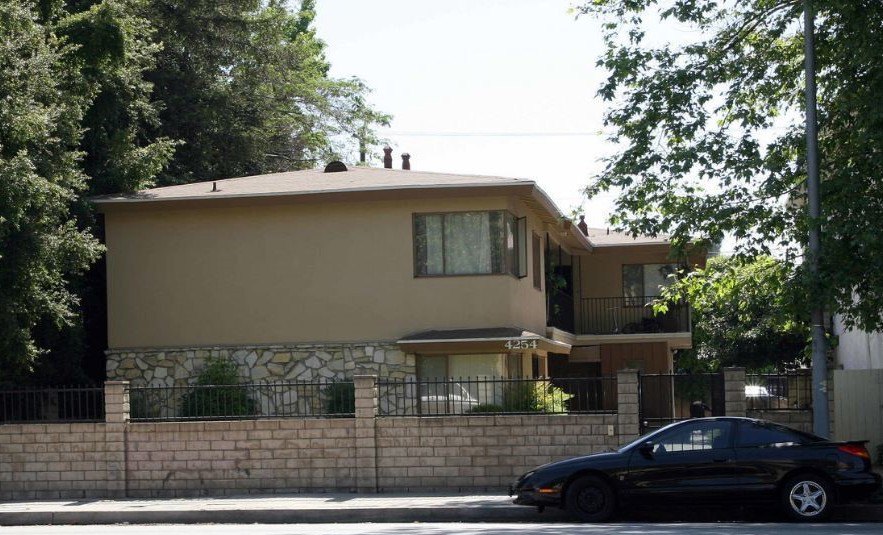
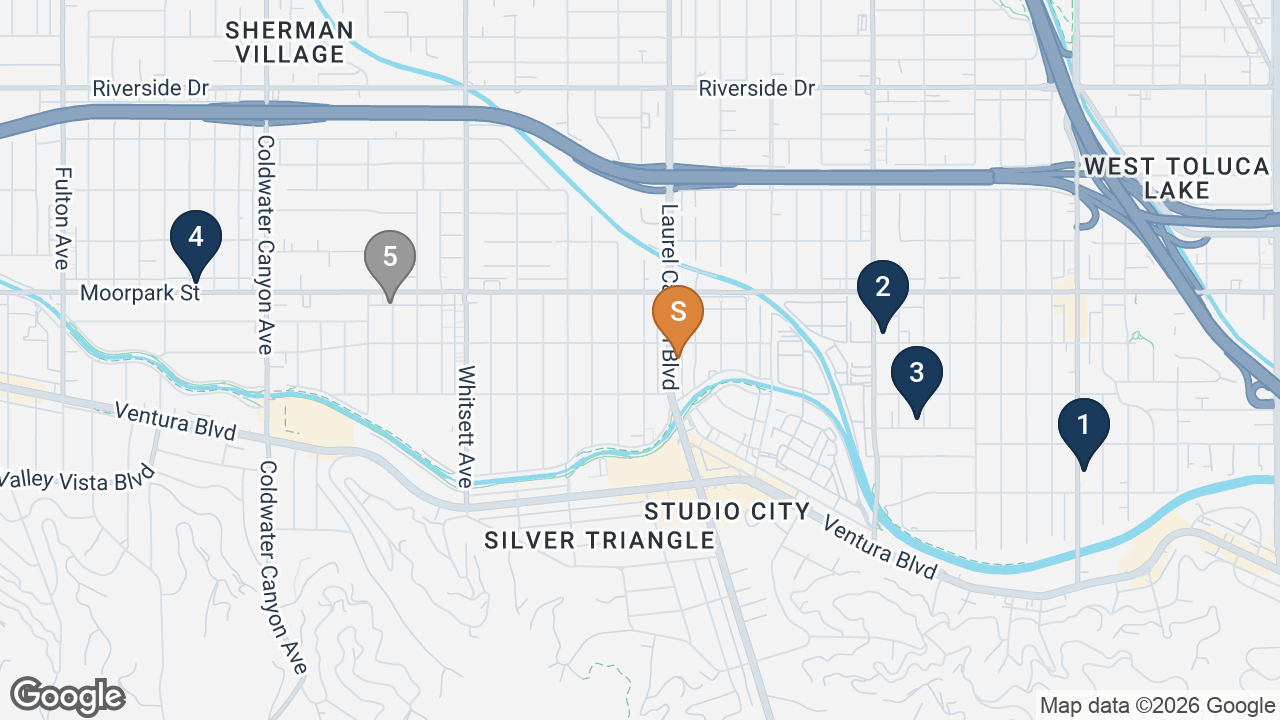
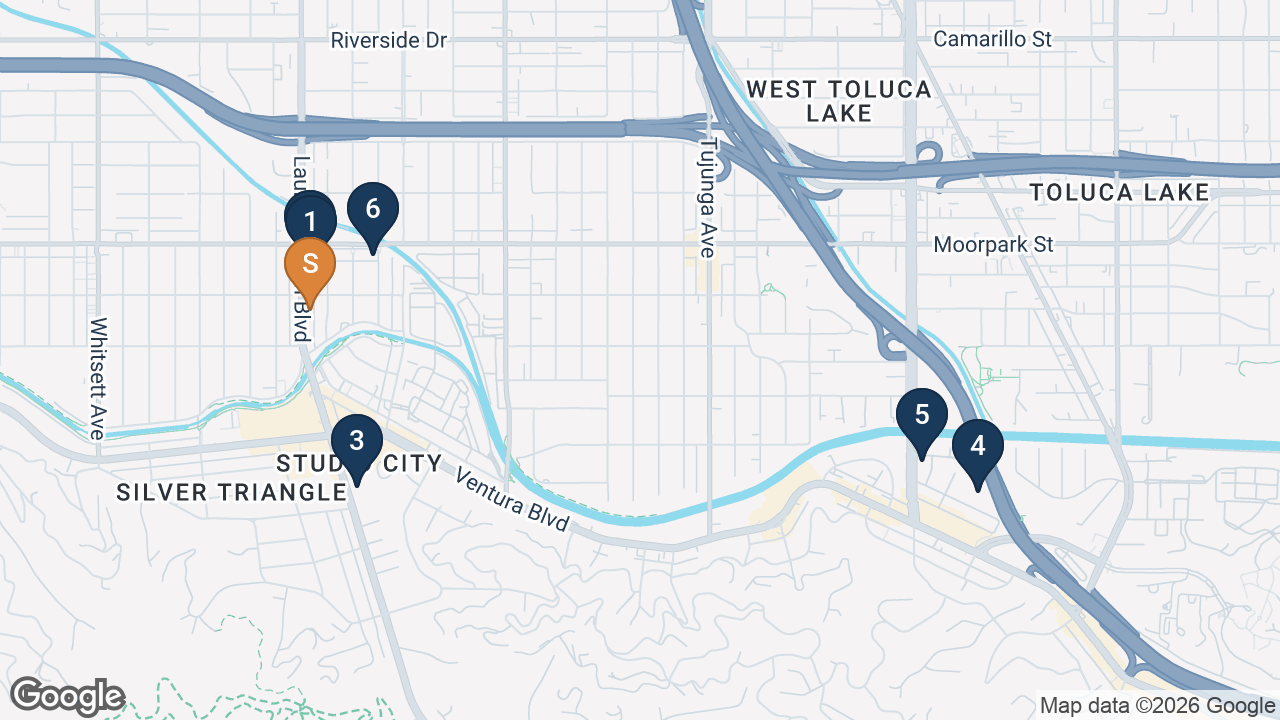
4254 Laurel Canyon Boulevard is a renovated, fully occupied five-unit apartment building in the heart of Studio City, held by the Robin Salame Family Trust. The asset pairs durable, rent-stabilized in-place income with the best walkability in its comp set and modest mark-to-market upside as units reset on turnover under Costa-Hawkins.
The seller position is straightforward: present a turned, fully occupied Studio City building positioned inside the re-underwritten comp set on every metric, with a documented path to a stronger stabilized yield as the lower-rent units reset to market on natural turnover. At the recommended value, the building trades at a 5.11% in-place cap and $270,000 per unit — inside every comp envelope. The mandatory soft-story seismic retrofit is already complete (Certificate of Compliance, October 2021), and recent capital work — a full copper repipe and electrical updates — further limits a buyer's near-term capital exposure.

4254 Laurel Canyon Boulevard sits on the Laurel Canyon corridor in central Studio City, minutes from Ventura Boulevard retail and dining, the studios, and the Cahuenga Pass to the Westside and Hollywood. It earns a Walk Score of 91 — a Walker's Paradise and the highest in the comp set — with everyday retail, dining, and transit at the doorstep.
The frontage is a working trade-off: a Laurel Canyon corridor address carries some street traffic, balanced by gated, off-street garage parking and the walkability and visibility the corridor provides. Studio City is among the most supply-constrained rental submarkets in the Valley — a built-out, low-density grid with limited new construction and durable renter demand that keeps the rental base tight and occupancy high.
| Location & Demand Drivers | |
|---|---|
| Submarket | Central Studio City |
| ZIP | 91604 |
| Walk Score | 91 (Walker's Paradise) |
| Retail / Dining | Ventura Blvd corridor |
| Employment | Universal Studios & CityWalk |
| Freeway Access | US-101 Hollywood Fwy |
| To the Westside | Direct via Laurel Canyon |
| Rent Control | LA RSO (all 5 units) |

| Property Overview | |
|---|---|
| Units | 5 |
| Year Built | 1956 (renovated) |
| Gross Building SF | 3,552 |
| Unit Mix | 4× 1BR/1BA, 1× 2BR/1BA |
| Occupancy | 100% |
| Condition | Renovated / turnkey |
| Site & Zoning | |
|---|---|
| APN | 2368-015-036 |
| Lot Size | 5,002 SF (0.12 ac) |
| Land Use | Multi-Family Res (5+ units) |
| Buildings | 1 building, two-story walk-up |
| Parking | Gated, off-street garage |
| Last Sale | Dec 2011 · $440,000 |
| Unit Mix Layout | |
|---|---|
| 1 Bed / 1 Bath | 4 units · 680 SF avg |
| 2 Bed / 1 Bath | 1 unit · 832 SF |
| Avg Unit Size | 710 SF |
| Current GSR | $118,644 |
| Pro Forma GSR | $139,800 |
| Regulatory & Utilities | |
|---|---|
| Rent Control (RSO) | LA RSO — all 5 units |
| Vacancy Decontrol | Costa-Hawkins on turnover |
| Owner Pays | Water / sewer, trash |
| Tenant Pays | In-unit electric & gas |
| Registration | LAHD rent registration current |


Exchange Buyer · 4.75–5.25% target cap
1031 exchange principals from the San Fernando Valley and Westside trading into a rent-controlled Studio City hold with organic turnover upside.
Local Apartment Owner · 4.75–5.25% target cap
Studio City and Valley owners adding a well-located small building on the Laurel Canyon corridor to a local portfolio.
Studio City scarcity, a renovated and fully occupied building, and the best walkability in its comp set should draw a deep, capital-rich pool of private buyers — the 9-offer, all-cash result on nearby 11607 Acama shows how deep that demand runs.
"It's a 1956 building."
It is renovated and fully occupied, and prices below the renovated benchmark — 4156 Tujunga at $411.57/SF — while delivering the same renovated-tier 5.11% yield at $380.07/SF.
"Rents are below market under rent control."
That is the upside, not a defect. Annual upside at full turnover is +$21,156 (+17%) under Costa-Hawkins vacancy decontrol. Pro forma rents are set at the comparable median, not the ceiling, and the subject's own renovated 1BR is currently listed at $2,200.
"Laurel Canyon frontage carries street traffic."
Offset by a Walk Score of 91 (highest in the comp set), gated off-street garage parking, and corridor visibility — and it is already reflected in pricing inside every comp envelope.
"Only five units — is the buyer pool deep enough?"
Five-to-ten-unit Studio City product is the most liquid tier in the Valley. The closest profile peer, 4350 Colfax, sold about 16% under ask at a verified 5.27% cap, and nearby value-add product drew nine all-cash offers.

| Address | Submarket | Yr | Units | Sale Price | $/Unit | $/SF | Cap | GRM | Dist | Sold |
|---|---|---|---|---|---|---|---|---|---|---|
| 4254 Laurel Canyon (subject) | Studio City | 1956 | 5 | $1,350,000 | $270,000 | $380.07 | 5.11% | 11.38 | — | In place |
| 12021 Hoffman Street LAAA Team Sale · OM ↗ | Studio City | 1937 | 5 | $1,495,000 | $299,000 | $447.07 | 4.40% | 13.80 | 0.4 mi | Nov 2024 |
| 10611 Landale Street LAAA Team Sale · OM ↗ | Toluca Lake | 1951 | 5 | $1,400,000 | $280,000 | $340.30 | 5.26% | 12.07 | 2.2 mi | Dec 2024 |
| 4156 Tujunga Avenue · OM ↗ | Studio City | 1971 | 6 | $1,899,000 | $316,500 | $411.57 | 5.11% | 12.41 | 1.6 mi | Feb 2026 |
| 4350 Colfax Avenue · photos ↗ | Studio City | 1958 | 9 | $2,000,000 | $222,222 | $339.90 | 5.27% | 11.64 | 0.8 mi | Nov 2025 |
| 11607 Acama Street · OM ↗ | Studio City | 1971 | 12 | $3,880,000 | $323,333 | $241.77 | 6.60% | 10.09 | 1.1 mi | Mar 2026 |
| 13021 Moorpark Street · OM ↗ | Studio City | 1978 | 14 | $4,400,000 | $314,286 | $328.46 | 6.84% | 10.19 | 1.3 mi | Apr 2026 |
| 4353 Teesdale Avenue (distressed) | Studio City | 1965 | 6 | $1,310,000 | $218,333 | $182.96 | NV | NV | 0.9 mi | Oct 2025 |
| Comparable averages (excl. distressed Teesdale) | $3,044,750 | $294,085 | $330.43 | 5.19% | 12.03 | — | — | |||
Each sale re-underwritten on a common basis (income re-cast the way a buyer would; property tax reassessed at its own sale price at 1.25%). Cap rate and GRM are shown only where current in-place income is verified from source documents — "NV" = not verified. 11607 Acama (6.60% cap / 10.09 GRM) and 13021 Moorpark (6.84% cap / 10.19 GRM) are computed from their offering memoranda (in-place NOI reassessed at each property's sale price); as larger value-add buildings they are shown for reference and held out of the renovated five-unit verified average (5.19% cap / 12.03 GRM, set by the closest peers 4156 Tujunga and 4350 Colfax). The 4353 Teesdale sale is a documented distressed transaction, shown as a forced-sale floor and excluded from the averages. 12021 Hoffman and 10611 Landale are LAAA Team closings — the two closest five-unit analogs — shown for reference with their offering memoranda; they are not part of the market-comp average row.
4156 Tujunga Avenue — The renovated six-unit benchmark and one of two verified-income comps. Even turnkey, it took 139 days and seller concessions to close at a verified 5.11% cap / 12.41 GRM. The subject prices below it on per-unit and per-SF for its smaller one-bedroom mix, at the same renovated-tier yield.
4350 Colfax Avenue — The closest profile peer: a one-bedroom-heavy 1958 nine-unit half a mile away, only partially updated, that sold about 16% under ask. It sets the price-per-unit floor and provides verified yield support at a 5.27% actual cap / 11.64 GRM.
11607 Acama Street — A larger value-add townhome sale that drew nine all-cash offers, live proof of how deep Studio City demand runs for rent-stabilized product. Its big two- and three-bedroom units top the per-unit band but bottom the per-SF band — the opposite pull from the subject's small one-bedrooms. At the $3.88M sale price its in-place income (per the OM) pencils to a 6.60% cap, the value-add townhome tier sitting above the renovated-product yield the subject prices at.
13021 Moorpark Street — A larger, substantially renovated 1978 fourteen-unit sale. Tenants pay their own utilities, unlike the owner-pays-water subject, so it is best read as an upper-tier condition and amenity benchmark. At the $4.4M sale price its in-place income (per the OM) pencils to a 6.84% cap / 10.19 GRM — the larger-building value-add tier sitting above the subject's renovated five-unit yield.
In-place rents sit below market — the result of long tenancies under LA rent stabilization. Under Costa-Hawkins vacancy decontrol, each unit resets to market on natural turnover, not by buyouts. Pro forma market rents are set at the comparable median (one-bedrooms near $2,250, the two-bedroom near $2,650) and are validated by recent Studio City lease comparables, including the subject's own renovated one-bedroom unit listed at $2,200.

| Set | Rent / Unit | Avg Size (SF) | Rent / SF |
|---|---|---|---|
| Subject — current | $1,911 | 680 | $2.81 |
| Subject — pro forma | $2,250 | 680 | $3.31 |
| 4334 Laurel Canyon Blvd · apartments.com ↗ | $2,274 | 650 | $3.50 |
| 4336 Laurel Canyon Blvd · apartments.com ↗ | $2,295 | 650 | $3.53 |
| 3930 Laurel Canyon Blvd · apartments.com ↗ | $2,199 | 650 | $3.38 |
| 11954 Moorpark St · apartments.com ↗ (active) | $1,850 | 600 | $3.08 |
| Comparable average | $2,155 | 638 | $3.37 |
| Set | Rent / Unit | Avg Size (SF) | Rent / SF |
|---|---|---|---|
| Subject — current | $2,245 | 832 | $2.70 |
| Subject — pro forma | $2,650 | 832 | $3.19 |
| 10915 Bluffside Dr · apartments.com ↗ | $2,425 | 900 | $2.69 |
| 10979 Bluffside Dr · apartments.com ↗ | $2,880 | 950 | $3.03 |
| 11954 Moorpark St · apartments.com ↗ (active) | $2,250 | 700 | $3.21 |
| Comparable average | $2,518 | 850 | $2.98 |
Comparables are recent active asking rents on and near the Laurel Canyon corridor, used to validate the pro forma market rents. Each pro forma rent clears the highest in-place rent for its type. Upside is captured on natural turnover, not by buyouts. Figures are estimates for discussion and should be confirmed at listing.
| Unit | Type | SF | Current Rent/Mo | Current $/SF | Pro Forma Rent/Mo | Status |
|---|---|---|---|---|---|---|
| 1 | 1 Bed / 1 Bath | 680 | $1,770 | $2.60 | $2,250 | Occupied |
| 2 | 1 Bed / 1 Bath | 680 | $1,950 | $2.87 | $2,250 | Occupied |
| 3 | 1 Bed / 1 Bath | 680 | $1,872 | $2.75 | $2,250 | Occupied |
| 4 | 1 Bed / 1 Bath | 680 | $2,050 | $3.01 | $2,250 | Occupied |
| 5 | 2 Bed / 1 Bath | 832 | $2,245 | $2.70 | $2,650 | Occupied |
| Total | 5 units | 3,552 | $9,887/mo | $2.78 | $11,650/mo | 100% occ. |
In-place rents reflect the current annualized rent schedule, consistent with the most recent owner statement ($9,887/mo = $118,644/yr). Pro forma rents ($11,650/mo = $139,800/yr) are reached only on natural turnover under Costa-Hawkins vacancy decontrol. Per-unit square footage is a model estimate by type pending measured floor plans.
| Income | Annual | Per Unit | $/SF |
|---|---|---|---|
| Gross Scheduled Rent [1] | $118,644 | $23,729 | $33.40 |
| Less: Vacancy & Credit Loss (3%) | ($3,559) | ($712) | ($1.00) |
| Effective Gross Income | $115,085 | $23,017 | $32.40 |
| Expenses | Annual | Per Unit | $/SF |
|---|---|---|---|
| Real Estate Taxes [2] | $15,795 | $3,159 | $4.45 |
| Insurance [3] | $6,150 | $1,230 | $1.73 |
| Water / Sewer | $5,867 | $1,173 | $1.65 |
| Management Fee [4] | $4,746 | $949 | $1.34 |
| Trash | $3,790 | $758 | $1.07 |
| Repairs & Maintenance | $3,750 | $750 | $1.06 |
| Reserves | $1,750 | $350 | $0.49 |
| Contract Services | $1,600 | $320 | $0.45 |
| Common Electric | $1,116 | $223 | $0.31 |
| General Admin | $1,000 | $200 | $0.28 |
| Rent Registration | $533 | $107 | $0.15 |
| Total Operating Expenses | $46,097 | $9,219 | $12.98 |
| Net Operating Income | $68,988 | $13,798 | $19.42 |
Expenses as % of EGI: 40.1% (current). Sale-basis underwriting; figures are estimates pending due diligence.
[1] Gross Scheduled Rent: Current income uses the in-place registered rents under LA rent stabilization ($9,887/mo × 12 = $118,644). Pro forma rent is shown separately and does not drive the in-place value recommendation.
[2] Real Estate Taxes: LA County reassesses to the purchase price at close. Shown at 1.17% of the recommended value; on the pricing matrix, taxes recompute at each price row.
[3] Insurance: Carrier-quoted allowance for a renovated 1956 five-unit, no fire zone.
[4] Management: Included at 4% of gross scheduled rent, even if ownership self-manages today.
Vacancy. Modeled at 3% of gross scheduled rent for a stabilized small multifamily.
Expense normalization. Operating expenses are scrubbed of one-time capital items and owner-level costs. Buyer to verify actuals in due diligence.
| Operating Data | |
|---|---|
| Recommended Price | $1,350,000 |
| Number of Units | 5 |
| Price / Unit | $270,000 |
| Price / SF | $380.07 |
| Gross SF | 3,552 |
| Year Built | 1956 |
| Returns (In-Place, Reassessed) | |
|---|---|
| Cap Rate | 5.11% |
| GRM | 11.38x |
| Pro Forma Cap (at turnover) | ~6.6% |
| Pro Forma GRM | 9.66x |
| Income (In-Place) | |
|---|---|
| Gross Scheduled Rent | $118,644 |
| Less Vacancy (3%) | ($3,559) |
| Effective Gross Income | $115,085 |
| Operating Expenses | ($46,097) |
| Net Operating Income | $68,988 |
| Expense Ratio | |
|---|---|
| OpEx / EGI | 40.1% |
| OpEx / Unit | $9,219 |
| OpEx / SF | $12.98 |
| Purchase Price | Price / Unit | Price / SF | Cap Rate | GRM |
|---|---|---|---|---|
| $1,500,000 | $300,000 | $422.30 | 4.48% | 12.64x |
| $1,450,000 | $290,000 | $408.22 | 4.68% | 12.22x |
| $1,400,000 | $280,000 | $394.14 | 4.89% | 11.80x |
| $1,350,000 | $270,000 | $380.07 | 5.11% | 11.38x |
| $1,300,000 | $260,000 | $365.99 | 5.35% | 10.96x |
| $1,250,000 | $250,000 | $351.91 | 5.61% | 10.54x |
| $1,200,000 | $240,000 | $337.84 | 5.90% | 10.11x |
Range metrics are shown on in-place income. Property tax is recomputed at each price row using a 1.17% reassessment rate, so the cap changes with both price and taxes. Price per SF uses gross building area of 3,552 SF.
The recommendation is the natural consensus of all four metrics weighed together, no single one leading. Against the re-underwritten Studio City set, 4254 Laurel Canyon — renovated, fully occupied, and the best-located building in the group — lands in the upper-middle on what you pay and at the renovated end on yield.
On a per-unit basis ($270,000), the subject sits below the comparable average of $294,085 and well below the renovated benchmark 4156 Tujunga ($316,500/unit), reflecting its smaller one-bedroom mix. On cap rate (5.11%), it matches the renovated benchmark's verified 5.11% and lands just inside the verified comp band (5.11%–5.27%). On price per SF ($380.07), it carries a modest premium consistent with a renovated, best-located building, while still pricing $32/SF below 4156 Tujunga's $411.57. The result is a number positioned to clear a disciplined, confidential process to private capital and 1031 buyers, with a documented path to a stronger stabilized yield as units reset on natural turnover.